工程师应用统计与概率 Applied Statistics And Probability For Engineers 英文原版
| 运费: | ¥ 0.00-16.00 |
| 库存: | 1 件 |


商品详情
Applied Statistics And Probability For Engineers, 7Th Edition: Asia Edition Set W/Study Guide
基本信息
Format:Paperback 479 pages
Publisher:Wiley (WileyPLUS Products)
Edition:7 ed
ISBN:9781119718871
Published:December 27, 2017
Weight:862g
Dimensions:193 x 252 x 25 (mm)
页面参数仅供参考,具体以实物为准
书籍简介
《工程师应用统计与概率》为工程师提供了一种实用的概率与统计方法。学生通过丰富的例子和问题集来学习材料如何与他们的职业相关,这些例子和问题集反映了现实的应用和情况。该产品侧重于真实的工程应用和真实的工程解决方案,同时包括bootstrap的材料,增加了对p值的使用、等效测试的覆盖和p值的组合的强调。本产品的基本内容、示例、练习和答案都经过仔细检查,以确保准确性。
Applied Statistics and Probability for Engineers provides a practical approach to probability and statistical methods. Students learn how the material will be relevant in their careers by including a rich collection of examples and problem sets that reflect realistic applications and situations. This product focuses on real engineering applications and real engineering solutions while including material on the bootstrap, increased emphasis on the use of p-value, coverage of equivalence testing, and combining p-values. The base content, examples, exercises and answers presented in this product have been meticulously checked for accuracy.
NEW TO THIS EDITION
Instructor Assignable Problems: Several hundred assignable problems that do not appear in student materials, preserving their integrity.
Practice Problems: Hundreds of practice problems called “Check Your Understanding” have been added and are placed at appropriate places in the e-text.
Videos: The course now features over 100 videos, many of which are walk-throughs of examples and problems.
FEATURES
New and expanded interactive features available in both WileyPLUS and the Interactive eText
Over 100 video-based examples and problem walk-throughs.
Check Your Understanding exercises are placed at the appropriate places in the eTextbook inside the WileyPLUS course. These simple practice exercises give students just-in-time reading comprehension self-assessment, perfect for assigning as a pre-lecture exercise.
Video Lectures: Video lectures provide explanations of key course concepts.
目录
1 The Role of Statistics in Engineering 1
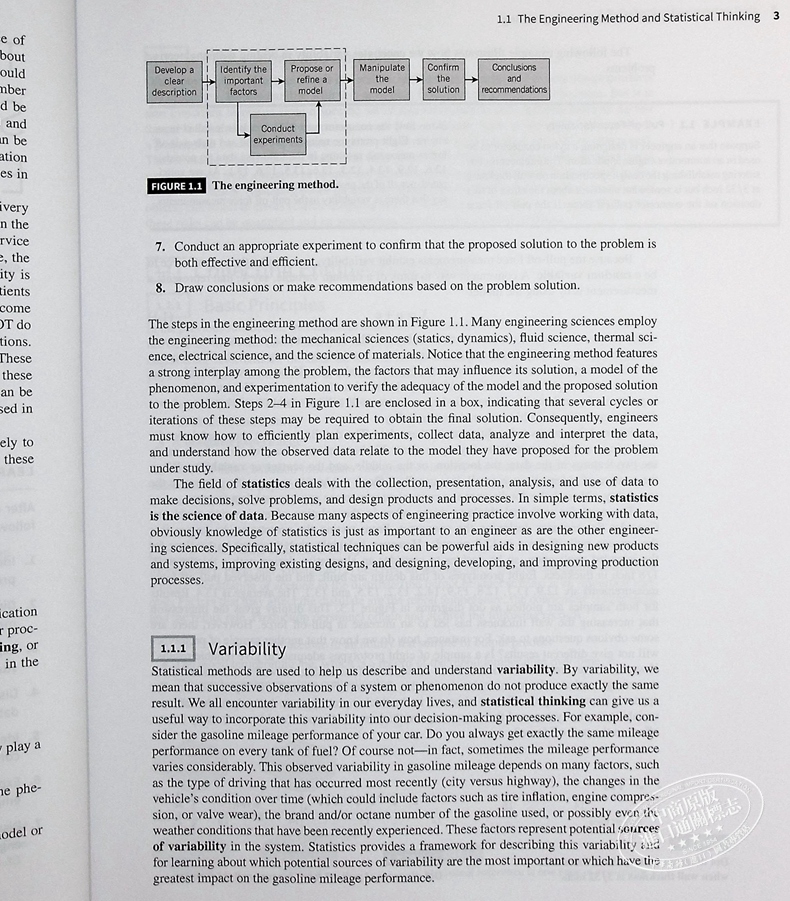
1.1 The Engineering Method and Statistical Thinking 2
1.1.1 Variability 3
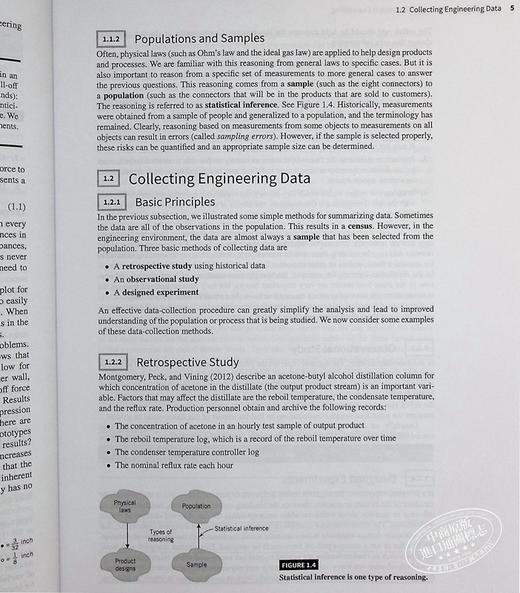
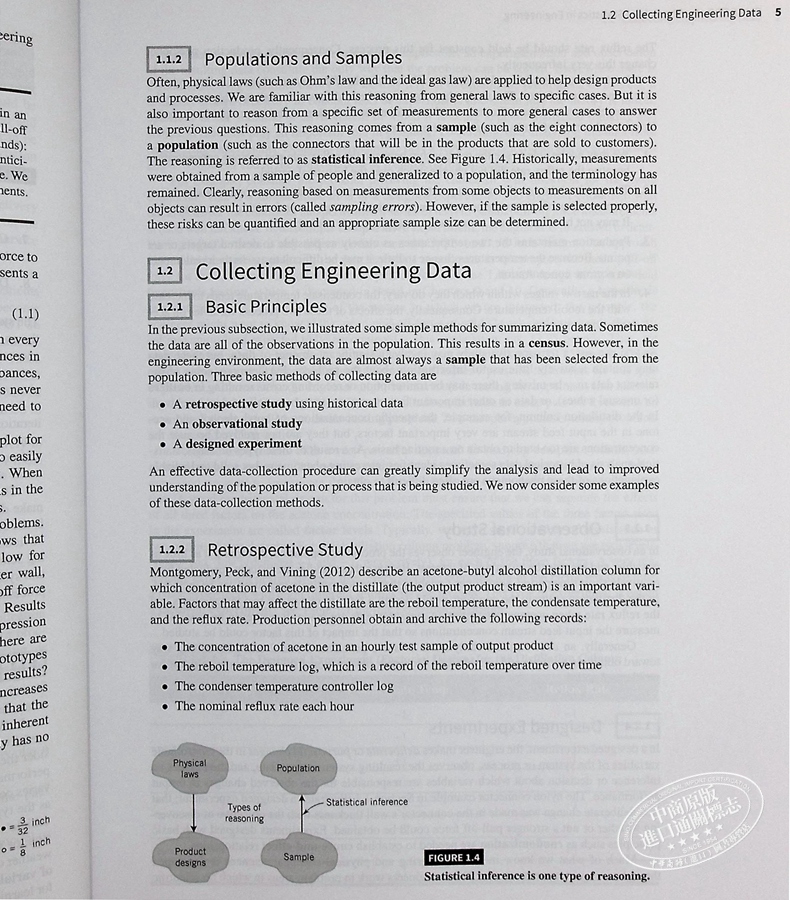
1.1.2 Populations and Samples 5
1.2 Collecting Engineering Data 5
1.2.1 Basic Principles 5
1.2.2 Retrospective Study 5
1.2.3 Observational Study 6
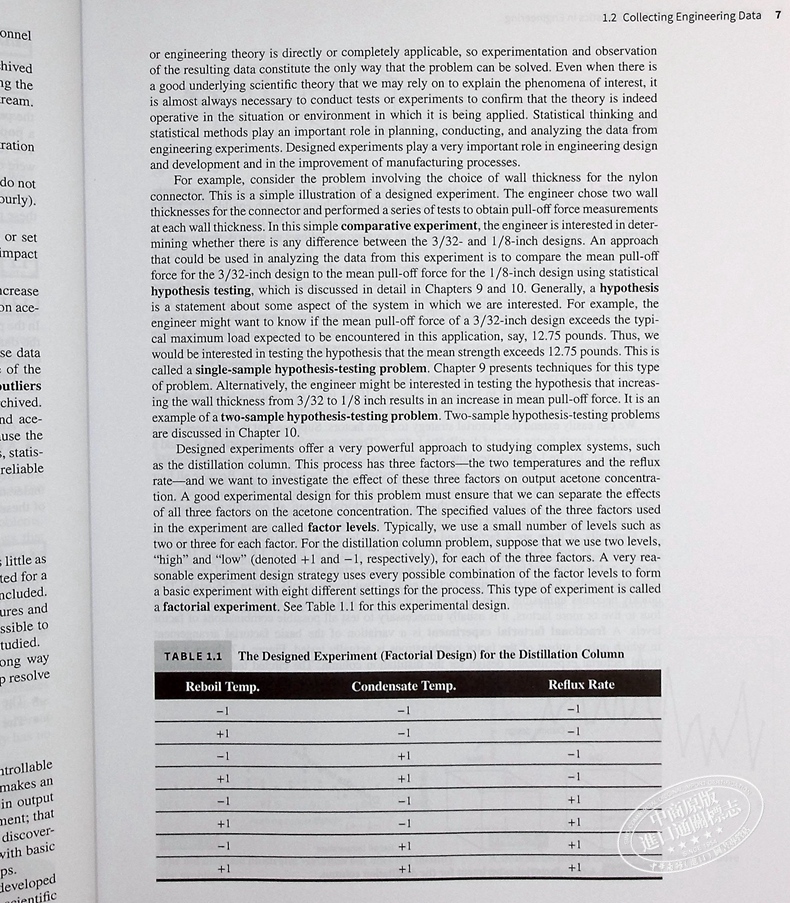
1.2.4 Designed Experiments 6
1.2.5 Observing Processes Over Time 9
1.3 Mechanistic and Empirical Models 12
1.4 Probability and Probability Models 15
2 Probability 17
2.1 Sample Spaces and Events 18
2.1.1 Random Experiments 18
2.1.2 Sample Spaces 19
2.1.3 Events 21
2.2 Counting Techniques 23
2.3 Interpretations and Axioms of Probability 26
2.4 Unions of Events and Addition Rules 29
2.5 Conditional Probability 31
2.6 Intersections of Events and Multiplication and Total Probability Rules 34
2.7 Independence 36
2.8 Bayes’ Theorem 39
2.9 Random Variables 40
3 Discrete Random Variables and Probability Distributions 42
3.1 Probability Distributions and Probability Mass Functions 43
3.2 Cumulative Distribution Functions 45
3.3 Mean and Variance of a Discrete Random Variable 47
3.4 Discrete Uniform Distribution 49
3.5 Binomial Distribution 51
3.6 Geometric and Negative Binomial Distributions 55
3.7 Hypergeometric Distribution 59
3.8 Poisson Distribution 63
4 Continuous Random Variables and Probability Distributions 66
4.1 Probability Distributions and Probability Density Functions 67
4.2 Cumulative Distribution Functions 70
4.3 Mean and Variance of a Continuous Random Variable 71
4.4 Continuous Uniform Distribution 72
4.5 Normal Distribution 73
4.6 Normal Approximation to the Binomial and Poisson Distributions 79
4.7 Exponential Distribution 83
4.8 Erlang and Gamma Distributions 86
4.9 Weibull Distribution 89
4.10 Lognormal Distribution 90
4.11 Beta Distribution 92
5 Joint Probability Distributions 95
5.1 Joint Probability Distributions for Two Random Variables 96
5.2 Conditional Probability Distributions and Independence 102
5.3 Joint Probability Distributions for More Than Two Random Variables 107
5.4 Covariance and Correlation 110
5.5 Common Joint Distributions 113
5.5.1 Multinomial Probability Distribution 113
5.5.2 Bivariate Normal Distribution 115
5.6 Linear Functions of Random Variables 117
5.7 General Functions of Random Variables 120
5.8 Moment-Generating Functions 121
6 Descriptive Statistics 126
6.1 Numerical Summaries of Data 127
6.2 Stem-and-Leaf Diagrams 131
6.3 Frequency Distributions and Histograms 135
6.4 Box Plots 139
6.5 Time Sequence Plots 140
6.6 Scatter Diagrams 142
6.7 Probability Plots 144
7 Point Estimation of Parameters and Sampling Distributions 148
7.1 Point Estimation 149
7.2 Sampling Distributions and the Central Limit Theorem 150
7.3 General Concepts of Point Estimation 156
7.3.1 Unbiased Estimators 156
7.3.2 Variance of a Point Estimator 157
7.3.3 Standard Error: Reporting a Point Estimate 158
7.3.4 Bootstrap Standard Error 159
7.3.5 Mean Squared Error of an Estimator 160
7.4 Methods of Point Estimation 161
7.4.1 Method of Moments 162
7.4.2 Method of Maximum Likelihood 163
7.4.3 Bayesian Estimation of Parameters 167
8 Statistical Intervals for a Single Sample 170
8.1 Confidence Interval on the Mean of a Normal Distribution, Variance Known 172
8.1.1 Development of the Confidence Interval and Its Basic Properties 172
8.1.2 Choice of Sample Size 175
8.1.3 One-Sided Confidence Bounds 176
8.1.4 General Method to Derive a Confidence Interval 176
8.1.5 Large-Sample Confidence Interval for μ 177
8.2 Confidence Interval on the Mean of a Normal Distribution, Variance Unknown 179
8.2.1 t Distribution 180
8.2.2 t Confidence Interval on μ 181
8.3 Confidence Interval on the Variance and Standard Deviation of a Normal Distribution 182
8.4 Large-Sample Confidence Interval for a Population Proportion 185
8.5 Guidelines for Constructing Confidence Intervals 188
8.6 Bootstrap Confidence Interval 189
8.7 Tolerance and Prediction Intervals 189
8.7.1 Prediction Interval for a Future Observation 189
8.7.2 Tolerance Interval for a Normal Distribution 191
9 Tests of Hypotheses for a Single Sample 193
9.1 Hypothesis Testing 194
9.1.1 Statistical Hypotheses 194
9.1.2 Tests of Statistical Hypotheses 196
9.1.3 One-Sided and Two-Sided Hypotheses 202
9.1.4 P-Values in Hypothesis Tests 203
9.1.5 Connection between Hypothesis Tests and Confidence Intervals 206
9.1.6 General Procedure for Hypothesis Tests 206
9.2 Tests on the Mean of a Normal Distribution, Variance Known 208
9.2.1 Hypothesis Tests on the Mean 208
9.2.2 Type II Error and Choice of Sample Size 211
9.2.3 Large-Sample Test 215
9.3 Tests on the Mean of a Normal Distribution, Variance Unknown 215
9.3.1 Hypothesis Tests on the Mean 215
9.3.2 Type II Error and Choice of Sample Size 220
9.4 Tests on the Variance and Standard Deviation of a Normal Distribution 222
9.4.1 Hypothesis Tests on the Variance 222
9.4.2 Type II Error and Choice of Sample Size 224
9.5 Tests on a Population Proportion 225
9.5.1 Large-Sample Tests on a Proportion 225
9.5.2 Type II Error and Choice of Sample Size 227
9.6 Summary Table of Inference Procedures for a Single Sample 229
9.7 Testing for Goodness of Fit 229
9.8 Contingency Table Tests 232
9.9 Nonparametric Procedures 234
9.9.1 The Sign Test 235
9.9.2 The Wilcoxon Signed-Rank Test 239
9.9.3 Comparison to the t-Test 240
9.10 Equivalence Testing 240
9.11 Combining P-Values 242
10 Statistical Inference for Two Samples 244
10.1 Inference on the Difference in Means of Two Normal Distributions, Variances Known 245
10.1.1 Hypothesis Tests on the Difference in Means, Variances Known 247
10.1.2 Type II Error and Choice of Sample Size 249
10.1.3 Confidence Interval on the Difference in Means, Variances Known 251
10.2 Inference on the Difference in Means of Two Normal Distributions, Variances Unknown 253
10.2.1 Hypotheses Tests on the Difference in Means, Variances Unknown 253
10.2.2 Type II Error and Choice of Sample Size 259
10.2.3 Confidence Interval on the Difference in Means, Variances Unknown 260
10.3 A Nonparametric Test for the Difference in Two Means 261
10.3.1 Description of the Wilcoxon Rank-Sum Test 262
10.3.2 Large-Sample Approximation 263
10.3.3 Comparison to the t-Test 264
10.4 Paired t-Test 264
10.5 Inference on the Variances of Two Normal Distributions 268
10.5.1 F Distribution 268
10.5.2 Hypothesis Tests on the Equity of Two Variances 270
10.5.3 Type II Error and Choice of Sample Size 272
10.5.4 Confidence Interval on the Ratio of Two Variances 273
10.6 Inference on Two Population Proportions 273
10.6.1 Large-Sample Tests on the Difference in Population Proportions 274
10.6.2 Type II Error and Choice of Sample Size 276
10.6.3 Confidence Interval on the Difference in Population Proportions 277
10.7 Summary Table and Road Map for Inference Procedures for Two Samples 278
11 Simple Linear Regression and Correlation 280
11.1 Empirical Models 281
11.2 Simple Linear Regression 284
11.3 Properties of the Least Squares Estimators 288
11.4 Hypothesis Tests in Simple Linear Regression 288
11.4.1 Use of t-Tests 289
11.4.2 Analysis of Variance Approach to Test Significance of Regression 291
11.5 Confidence Intervals 292
11.5.1 Confidence Intervals on the Slope and Intercept 292
11.5.2 Confidence Interval on the Mean Response 293
11.6 Prediction of New Observations 295
11.7 Adequacy of the Regression Model 296
11.7.1 Residual Analysis 296
11.7.2 Coefficient of Determination (R2) 298
11.8 Correlation 299
11.9 Regression on Transformed Variables 303
11.10 Logistic Regression 305
12 Multiple Linear Regression 310
12.1 Multiple Linear Regression Model 311
12.1.1 Introduction 311
12.1.2 Least Squares Estimation of the Parameters 314
12.1.3 Matrix Approach to Multiple Linear Regression 316
12.1.4 Properties of the Least Squares Estimators 321
12.2 Hypothesis Tests in Multiple Linear Regression 322
12.2.1 Test for Significance of Regression 322
12.2.2 Tests on Individual Regression Coefficients and Subsets of Coefficients 325
12.3 Confidence Intervals in Multiple Linear Regression 329
12.3.1 Confidence Intervals on Individual Regression Coefficients 329
12.3.2 Confidence Interval on the Mean Response 330
12.4 Prediction of New Observations 331
12.5 Model Adequacy Checking 333
12.5.1 Residual Analysis 333
12.5.2 Influential Observations 335
12.6 Aspects of Multiple Regression Modeling 337
12.6.1 Polynomial Regression Models 337
12.6.2 Categorical Regressors and Indicator Variables 339
12.6.3 Selection of Variables and Model Building 341
12.6.4 Multicollinearity 349
13 Design and Analysis of Single-Factor Experiments: The Analysis of Variance 351
13.1 Designing Engineering Experiments 352
13.2 Completely Randomized Single-Factor Experiment 353
13.2.1 Example: Tensile Strength 353
13.2.2 Analysis of Variance 354
13.2.3 Multiple Comparisons Following the ANOVA 359
13.2.4 Residual Analysis and Model Checking 361
13.2.5 Determining Sample Size 363
13.3 The Random-Effects Model 365
13.3.1 Fixed Versus Random Factors 365
13.3.2 ANOVA and Variance Components 365
13.4 Randomized Complete Block Design 368
13.4.1 Design and Statistical Analysis 368
13.4.2 Multiple Comparisons 372
13.4.3 Residual Analysis and Model Checking 373
14 Design of Experiments with Several Factors 375
14.1 Introduction 376
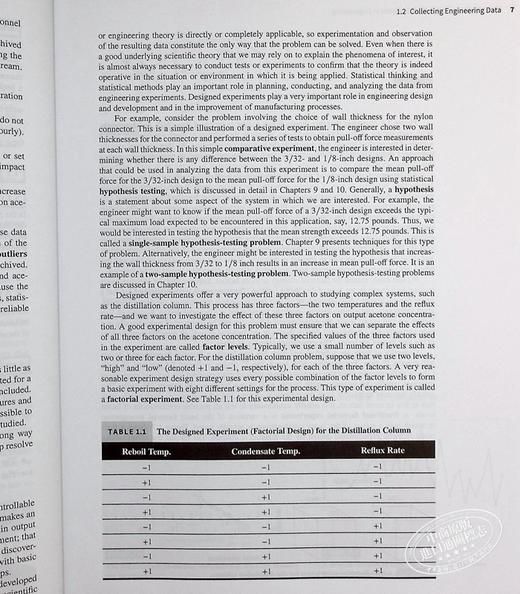
14.2 Factorial Experiments 378
14.3 Two-Factor Factorial Experiments 382
14.3.1 Statistical Analysis 382
14.3.2 Model Adequacy Checking 386
14.3.3 One Observation per Cell 387
14.4 General Factorial Experiments 388
14.5 2k Factorial Designs 390
14.5.1 22 Design 390
14.5.2 2k Design for k ≥ 3 Factors 396
14.6 Single Replicate of the 2k Design 402
14.7 Addition of Center Points to a 2k Design 405
14.8 Blocking and Confounding in the 2k Design 408
14.9 One-Half Fraction of the 2k Design 413
14.10 Smaller Fractions: The 2k−p Fractional Factorial 418
14.11 Response Surface Methods and Designs 425
15 Statistical Quality Control 434
15.1 Quality Improvement and Statistics 435
15.1.1 Statistical Quality Control 436
15.1.2 Statistical Process Control 436
15.2 Introduction to Control Charts 436
15.2.1 Basic Principles 436
15.2.2 Design of a Control Chart 440
15.2.3 Rational Subgroups 441
15.2.4 Analysis of Patterns on Control Charts 442
15.3 X and R or S Control Charts 444
15.4 Control Charts for Individual Measurements 450
15.5 Process Capability 452
15.6 Attribute Control Charts 456
15.6.1 P Chart (Control Chart for Proportions) 456
15.6.2 U Chart (Control Chart for Defects per Unit) 458
15.7 Control Chart Performance 460
15.8 Time-Weighted Charts 462
15.8.1 Exponentially Weighted Moving-Average Control Chart 462
15.8.2 Cumulative Sum Control Chart 465
15.9 Other SPC Problem-Solving Tools 471
15.10 Decision Theory 473
15.10.1 Decision Models 473
15.10.2 Decision Criteria 474
15.11 Implementing SPC 476
Appendix A Statistical Tables and Charts A-3
Table I Summary of Common Probability Distributions A-4
Table II Cumulative Binomial Probabilities P(X ≤ x) A-5
Table III Cumulative Standard Normal Distribution A-8
Table IV Percentage Points χ2α,v of the Chi-Squared Distribution A-10
Table V Percentage Points tα,v of the t Distribution A-11
Table VI Percentage Points fα,v1,v2 of the F Distribution A-12
Chart VII Operating Characteristic Curves A-17
Table VIII Critical Values for the Sign Test A-26
Table IX Critical Values for the Wilcoxon Signed-Rank Test A-26
Table X Critical Values for the Wilcoxon Rank-Sum Test A-27
Table XI Factors for Constructing Variables Control Charts A-28
Table XII Factors for Tolerance Intervals A-29
Appendix B Bibliography A-31
Appendix C Summary of Confidence Intervals and Hypothesis Testing Equations for One and Two Sample Applications A-33
Glossary G-1
Exercises P-1
Index I-1
作者简介
道格拉斯·蒙哥马利是亚利桑那州立大学工程学教授。他的研究方向是工业统计。他著有16本书和200多篇技术论文。他是休哈特奖章、布兰博奖、亨特奖、休威尔奖和埃利斯R.奥特奖的获得者。蒙哥马利还是ENBIS(欧洲商业和工业统计网络)颁发的乔治·博克斯奖章的获得者。
蒙哥马利是美国统计学会、美国质量控制学会、皇家统计学会、工业工程师学会的会员,也是国际统计学会的民选成员。
Douglas Montgomery is a Regents Professor of Industrial Engineering and Statistics. His research interests are in industrial statistics. He is an author of 16 books and more than 200 technical papers. He is a recipient of the Shewhart Medal, the Brumbaugh Award, the Hunter Award, and the Shewell Award, and the Ellis R. Ott Award. Montgomery is also a recipient of the George Box Medal from ENBIS (European Network For Business and Industrial Statistics).
Montgomery is a fellow of the American Statistical Association, the American Society for Quality Control, the Royal Statistical Society, the Institute of Industrial Engineers, and an elected member of the International Statistical Institute.dition Set W/Study Guide
- 中商进口商城 (微信公众号认证)
- 中商进口商城中华商务贸易有限公司所运营的英美日韩港台原版图书销售平台,旨在向内地读者介绍、普及、引进最新最有价值的国外和港台图书和资讯。
- 扫描二维码,访问我们的微信店铺
- 随时随地的购物、客服咨询、查询订单和物流...